Divvy Data Dashboard
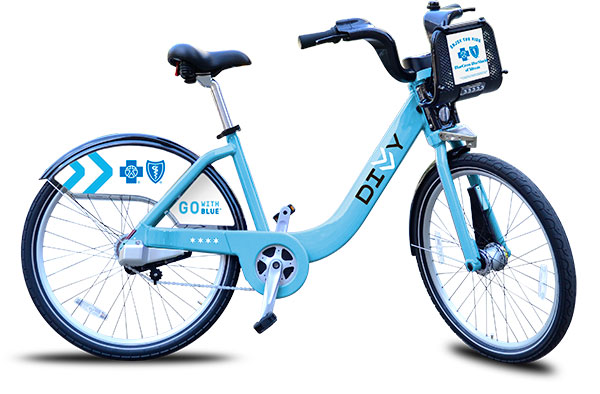
Divvy is a bike sharing system in Chicago that makes thousands of bikes available for rent at various locations throughout the city. Each station has a touchscreen kiosk and a docking system that releases bikes using a membership key or a one-time ride code for guests.
In early 2014, Divvy released a data feed of the nearly 760,000 rides taken on Divvy bikes in its inaugural year of 2013. This was part of the Divvy Data Challenge. Unfortunately, Spantree was heads down working on a few client projects and didn't get a chance to compete in the challenge, but we later took the opportunity to incorporate Divvy data into our Elasticsearch Workshop. We loved playing with the data so much that we decided to also create this data visualization powered by D3.js, Crossfilter, dc.js and Coffeescript. It works best in Google Chrome. All source code is available on Github.
The charts you see below are entirely interactive. Data is loaded into the browser as a CSV. All the processing and filtering takes place in the browser as well. Due to the amount of data, some filters are a little slow, so be patient. There's a wealth of insights below. What's the most popular day for female riders? Who is most likely to ride past midnight? Are non-subscribers more likely to get dinged for keeping a bike out for more than 30 minutes? What types of people were hardcore enough to still be on a bike in late December? Learn how these little blue bicycles became a part of the Chicago experience.

